
The Wealth Gap
Recently I posted several times regarding the income gap disparity and the fact that it continues to widen. I also think it important to examine how this impacts our system of Capitalism, which I advocate. It doesn’t take a genius to realize that as the income gap widens so does the distribution of wealth. The following chart illustrates that, as a country we were making good progress in wealth distribution until the mid-80s at which point the trend takes a nosedive. This coincides with the time when inflation adjusted wages began the stagnation which continues today, despite our increase in GNP during the same period.
The share of wealth owned by the top 0.1% is almost the same as the bottom 90%
The share of wealth owned by the top 0.1% is almost the same as the share owned by the bottom 90%
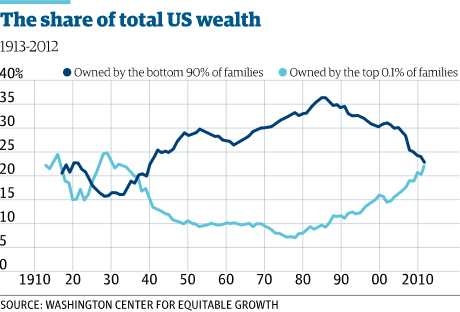
The research by Emmanuel Saez and Gabriel Zucman [pdf] illustrates the evolution of wealth inequality over the last century. The chart shows how the top 0.1% of families now own roughly the same share of wealth as the bottom 90%.
What this illustrates that as our country’s wealth has grown in the past 35 years only the super-rich have benefited and the middle class has been screwed. The Capitalism playing field has been manipulated. A Capitalistic system means that capital is king. Those with wealth and excess capital control the system. In a situation where .1% control as much of the capital as the group that includes all of the “middle-class” guess who is in total control.
Next week we will examine what changed in the mid-80s that has led to this unacceptable disparity.
The growing indebtedness of most Americans is the main reason behind the erosion of the wealth share of the bottom 90%, according to the report’s authors. Many middle-class families own their homes and have pensions, but too many have higher mortgage repayments, higher credit card bills, and higher student loans to service. The average wealth of bottom 90% jumped during the stock market boom of the late 1990s and the housing bubble of the early 2000s. But it then collapsed during and after the most recent financial crisis. What about the rising cost of Healthcare and advanced education….along with the previously mentioned wage stagnation.
Since then, there has been no recovery in the wealth of the middle class and the poor, the authors say. The average wealth of the bottom 90% of families is equal to $80,000 in 2012— the same level as in 1986. In contrast, the average wealth for the top 1% more than tripled between 1980 and 2012.


